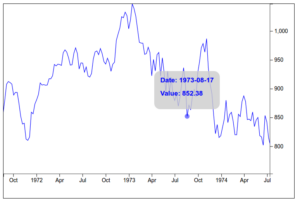
Adding tool-tips to an interactive chart.
This is Part 2 of a three part tutorial exploring building interactive charts with D3. Part 1 can be found here.
Other blog posts which can be used as introductory material to this series:
- Meet D3: Data Driven Documents – an overview of what D3 is and is not.
- D3: Binding Data – explores the heart and soul of D3: data binding.
- D3: Getting Interactive With Your SVG Elements – explores user interaction capabilities with SVG.
This tutorial is Part 2 in a multi-part tutorial exploring interactive SVG charts. We will pick up where we left off in Part 1 by adding tool-tips to each data point in the chart which become activated when a mouse hovers over a point.
We’ll progress over a series of "slides," each showing an active SVG element with narrative text describing the key points of the slide, along with the javascript code that generated the SVG. As this is a tutorial on user interaction with SVG, you get to play along as we go.
This tutorial is a single-page app requiring a modern browser (tested on recent chrome, firefox, IE). Because this tutorial explores zooming, you will need to be using a computer with a wheel mouse. This tutorial can be run live in your browser at the wonderful bl.ocks.org site. If so inclined, you can also clone the tutorial from gist and run it locally on your computer.
Regardless of how you view the tutorial, you can leave comments about it here.
Enjoy!