Introduction
There are many tutorials on the web to get one started using D3. Links to some of these works will follow later in this article. While they are all wonderful (and I thank each author for getting me over the steep D3 learning curve), most of these tutorials assume you know what D3 is, know you want to use it, and jump into the heart of D3 (data joins), which is kind of mind blowing and hard to wrap your head around.
Being on the flip-side of the learning curve, I look back at these tutorials and understand why the learning curve was so steep: D3 is not what you think it is (i.e, it’s not an SVG library), but is exactly as its name implies, a tool to drive data through your documents. D3’s heart is a mechanism to bind data to the DOM, including tools for handling deltas in a changing stream of data, which makes it a powerful tool for managing, in particular, visualizations. And that means dynamic, interactive SVG.
But even now I’m getting ahead of myself. I’m going to start from the beginning…
My Assignment
Recently I was assigned a project to build a highly interactive chart. A non-disclosure prevents me from sharing a screen shot, but suffice it to say, there’s lots of lines to plot, any of which can be turned on or off via a complex legend, there’s lots of zooming and panning of time-series data, and alerts appear on the chart, which, when clicked, show popups with detailed data.
A previous phase of the work had a much simpler graph (one line per graph) built with nvd3, a library built on D3. It was assumed I would continue to use nvd3 (or similar library, like rickshaw) for this complex chart, but was allowed time to explore other possibilities, including raw D3.
I took a step even further back…
<canvas> or <svg>
In modern browsers (and by this I mean recent firefox, chrome, safari, and IE9+), there are two standards for drawing on the page: <canvas> and <svg>. Did it make sense to consider <canvas> for this project?
<canvas>
Let’s look at a simple canvas example:
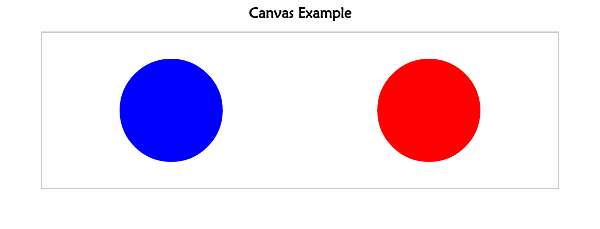
The above is rendered with this HTML:
<body>
      <div class="title">
        <h1>Canvas Example</h1>
      </div>
        <canvas id="mycanvas" width="1000" height="300"></canvas>
        <script src="canvas.js"></script>
</body>
You will notice the <canvas> tag: it has an id and specifies a width and height, setting the canvas to 1000×300. The canvas tag supports HTML global and event attributes, but otherwise has only two attributes, width and height (which default to 300×150). So, where do the circles come from? A canvas specifies a two-dimensional space within the document to draw 2d graphics with a javascript API.
The loaded script draws the circles:
function draw() {
       /* Canvas example - draw two circles */
       // get the canvas element and 2d context
       var canvas = document.getElementById("mycanvas");
       var ctx = canvas.getContext("2d");
       // draw a blue circle
       ctx.fillStyle = "blue";
       ctx.beginPath();
       ctx.arc(250, 150, 100, 0, Math.PI*2);
       ctx.fill();
       // craw a red circle
       ctx.fillStyle = "red";
       ctx.beginPath();
       ctx.arc(750, 150, 100, 0, Math.PI*2);
       ctx.fill();
    }
    draw();
The Canvas API is very simple to use. The details of the above are beyond the scope of this document, but you can quickly scan the code to see a 2d context is retrieved (by referencing the ID of the canvas), and two arcs are drawn, one blue and one red. See MDN’s wonderful documentation for API details and tutorials.
A few take-aways:
- A canvas creates a bitmap image. There are no objects created or retained. Once drawn, its just bits on the canvas. To create a “circle” as an object, to be later manipulated, a separate data structure would need to be managed.
- Because no object exists, if we wanted to change the red circle to green, we’d have to redraw the canvas.
- Again, because there are no objects within the canvas, interacting with the bitmap is difficult. How do we know if a user clicks on the red circle? We would have to maintain our own mapping of objects to their locations so mouse coordinates could be targeted. Painful!
It would appear we could draw any chart easily with canvas, but manipulating it and interacting with it is very, very difficult.
<svg>
Let’s look at the same graphic, but this time using SVG:

The above is rendered with this HTML:
    <body>
      <div class="title">
        <h1>SVG Example</h1>
      </div>
      <svg width="1000" height="300">
        <circle id="c1" cx="250" cy="150" r="100" fill="blue"></circle>
        <circle id="c2" cx="750" cy="150" r="100" fill="red"></circle>
      </svg>
    </body>
No javascript! The "canvas" and objects within are fully represented within the DOM. Instead of bits within a bitmap, we have actual circle objects with attributes that define the circle. This means we can manipulate and interact with the objects of our chart after they have been drawn…
To change the red circle to green:
var c2 = document.getElementById('c2');
    c2.setAttribute('fill', 'green');
To move the (now) green circle to the left:
c2.setAttribute('cx', 500);
To make the circle tiny:
c2.setAttribute('r', 25);
And to add an event listener:
    c2.addEventListener('click', function() {
       alert('Tiny green circle clicked!');
    });
Clearly, SVG provides a higher order of abstraction when compared to canvas’ bitmap images. (While I don’t know, one can imagine that SVG is implemented with the underlying canvas technology of a browser.)
At this point of understanding, it was clear to me that SVG was, in fact, the proper technology to use for a complex chart requiring manipulation and interactivity after it was drawn.
A Basic Knowledge of SVG Is Required
As stated above, D3 is not an SVG library, per se. Jumping into D3 (for purposes of creating visualizations) without any prior knowledge of SVG will make the learning curve all the more steeper.
There are many, many fine SVG tutorials on the web. These two are great:
Javascript Libraries
Having decided SVG was the correct technology, which javascript library was I going to use? Searching the web for "javascript svg" you will discover two classes of libraries: 1) libraries that map svg elements to functions (e.g, to create a circle, you call a circle() function), which I think of as literal libraries, and 2) DOM manipulation libraries, lead by D3 and its offspring.
Literal Libraries
For years, the defacto standard for javascript manipulation of SVG has been Raphaël. In no small part, because Raphaël’s higher order functions support older IE browsers (back to IE6), falling back to using VML for those browsers. Write once, run anywhere.
You can see the literalness of SVG in javascript code with this snippet:
    // Creates canvas 320 x 200 at 10, 50
    var paper = Raphael(10, 50, 320, 200);
    // Creates circle at x = 50, y = 40, with radius 10
    var circle = paper.circle(50, 40, 10);
    // Sets the fill attribute of the circle to red (#f00)
    circle.attr("fill", "#f00");
    // Sets the stroke attribute of the circle to white
    circle.attr("stroke", "#fff");
Other libraries of this class include:
- snap http://snapsvg.io/. Snap was written entirely from scratch by the author of Raphaël, designed specifically for modern browsers, allowing the library to take advantage of modern features.
- svg.js http://svgjs.com/, jQuery SVG http://keith-wood.name/svg.html. These libraries (and others) have similar look and feel to Raphaël and snap: map svg elements to objects, manipulating attributes via methods on the objects. Each supports advanced manipulations (animations) and/or graphing via higher-order classes and methods.
D3 and Its Progeny
Unlike the above libraries, D3 does not map svg elements to javascript objects. You will not find anywhere in its API a Circle object you can instantiate with getter and setter methods for its radius. (Also, unlike, say, Raphaël, D3 makes no effort to support older browsers.)
It is, first and foremost, a framework for working with data:
- It augments javascript with objects managing higher order data structures than are presently provided by implementations of ECMAScript 5, such as maps, sets, and nests.
- It provides many functions over many domains (geography, geometry, layouts, scales, time), implementing algorithms useful in visualization.
- Most compellingly, it provides a unique method of binding data to DOM elements, which, when applied to SVG, creates dynamic, interactive charts and visualizations.
Risking sounding like a broken record, I cannot stress enough that D3 is not what you think it is.
Whet Your Appetite
There are many amazing examples of D3 on the web. A rather large collection can be found at the official D3 Gallery. Here are three of my favorites (but I caution you: hours of your life will be lost playing with these!):
- Epicyclic Gearing
- Collision Detection
- Drag and Drop, Zoomable, Panning, Collapsible Tree with auto-sizing
Many, MANY Libraries Based On D3
D3 has a reputation for having a steep learning curve. Whether it’s because of a mismatch of expectations and reality (as this tutorial suggests, at least in part), or it is actually difficult to grok, many projects exist to ease the supposed D3 pain and provide libraries for specialized visualization needs.
This blog post has a long list of projects that package D3 for specific visualization domains, from visualizing data from specific data stores to generalized charting tools.
At the very top of the post is a list of many fine D3 tutorials. My personal favorites were Scott Murray’s tutorials and his book. Each of the listed tutorials is worth a read, but each suffers from the jump-in-head-first perspective I mentioned at the start of this article. They will be great resources after you wrap your head around what D3 is not, and have an idea of what it actually is!
Why, in the end, I did not choose nvd3 or rickshaw…
As mentioned above, both nvd3 and rickshaw are general purpose charting libraries, so why not use one of these tools? In brief: my charting project was just too specialized and complex and I realized I would be fighting the toolkits from beginning to end, and would have to use D3 anyway to get my custom components in their charts. Could it be done? Sure. Would it have saved me time? Doubtful.
While wrestling over the decision, one important factor was the availability of descent documentation. D3 has very good documentation. Both nvd3 and rickshaw have <rant>NO API DOCUMENTATION AT ALL</rant>. Even their source code repositories are shockingly absent of any internal comments. Ugh.
So, after writing a simple, sample application in D3, nvd3 and rickshaw, and realized D3’s learning curve was not as steep as I first feared, I willingly plunged in and have been very happy with that decision.
D3 API Tour
One last thing before plunging into a sample application. Take a quick look at the API Documentation. I don’t mean read it (that will come in time), but just scroll down the page to get a sense of the immense scope of the API. That’s a LOT of functionality packed into 151K (minified).
Two things to point out:
- You will notice a lot of functions related to selections. Think jQuery: much of the functionality in jQuery is supplied by D3. Strange? At first, yes! And this is where I think many newbies to D3 stumble, but this is the heart of D3: manipulating data via selections.
- You may notice a number of functions in the
d3.svgnamespace. Do not be fooled! These are not what you think they are!! They do not draw circles or rectangles. They are functions that generate data to be used with your selections and bound data.
Dots! A D3 Sample Application
Finally. Actual D3 code!
There is a live demo of this application hosted over at bl.ocks.org.
At the bottom of index.html, you will see this javascript code:
    dots = d3.sample_dots({width:600, height:300});
    d3.select("#dots").call(dots);
The first line creates a function with the specified configuration (setting the width of the svg to 600x300px). This function is then called on the selection "#dots" (a div in the DOM). The second line is identical to this:
dots(d3.select("#dots"));
Using the .call() function is idiomatic for D3 and will become obvious why it is so, as you become more familiar with the API.
The application paints puddles of dots: for each iteration, eight to sixty-four randomized dots (color, location, radius) are generated and animated on the canvas. If a previous group of dots already exists, they evaporate and are removed as the new batch forms.
You can interact with the dots: hovering your mouse over a dot while it exists will show a tooltip with details about the color.
At the bottom right of the iframe, there is a link, Open in a new window. If you do this, then open a developer console, you can interact with the dots via javascript:
    dots.stop()   // stops the animation
    dots.paint()  // paints one iteration, then stops
    dots.go()     // restarts the animation
go() calls paint() and then sets a timer to call itself in five seconds. stop() clears the timer. The heart of the application is the paint() function. Let’s break it down:
    dots.paint = function() {
       /* paint a new set of dots */
       var update,
           data = fetchData();
       // get an update selection (probably empty) after binding to new
       // set of data.  See: http://bost.ocks.org/mike/join/
       update = vis.selectAll('circle')
          .data(data, dataKey);
We declare a few variables. data holds a randomized selection of dots. Each dot is an object of the form:
    {
     x: <x-coord of center>
     y: <y-coord of center>
     r: <radius>
     c: <color object>
    }
Each value is randomized. The color object contains properties of the color, its name, hex, and RGB values. (BTW, kudos to jjdelc for the crayola colors!)
update is set to the selection of all <circle> elements in the svg. (vis is set at initialization to a d3.selection of the <svg> element inserted into the DOM.) And then the data is bound to this selection with the data() function.
If there is one thing you should spend time grokking, it’s understanding data binding and D3’s concept of a join (not unlike an SQL join). When you call data() on a selection, it binds the data (an array) to the selection, one datum per element in the selection. Based on the existence of data previously bound to the same selection, data() creates three selections:
- update – the update selection: those elements that were previously bound to the same data, i.e, for those elements that already exist in the DOM and are bound to the same data. Typically, elements of this selection will have attributes updated.
- enter – the enter selection: those elements that are new, i.e, we have data for elements that do not yet exist in the DOM. Typically, elements will be added to the DOM based on this selection.
- exit – the exit selection: those elements that are old, i.e, we have preexisting elements for which there is no data. Typically, these elements will be removed from the DOM.
The author of D3, Mike Bostock, has written a wonderful article explaining this join process, Thinking with Joins. READ IT. Read it again. Seriously, grokking this pays dividends!
The data() method returns the update selection. Hanging off the update selection are the enter and exit selections, each returned by a function of the same name.
       // new dots
       update.enter()
          .append('circle')
          .attr('r', 0)
          .attr('opacity', 0.6)
          .attr('fill', function(d){return d.c.hex;})
          .on('mouseover', tip.show) // for mouse hovering over dots
          .on('mouseout', tip.hide)
          .transition()  // animate radius growing
          .duration(4500)// over 4.5 seconds
          .attr('r', function(d) {return d.r;});
The next statement, a long chain of function calls (again, very idiomatic of D3 programming), first calls enter(), returning a selection of circles that do not exist. For each, we append a circle, setting several attributes. In some cases the attributes values are constant:
.attr('r', 0)
The above sets the radius to zero. Other values are functions:
.attr('fill', function(d){return d.c.hex;})
The above sets the fill based on the data for the current element being added. If you recall, each datum was an object that had a c property, the color object, and we’re using the hex value to set the fill color of the circle. Dynamic values based on data bound to the element!
After setting attributes we attach a few event handlers to manage the tooltips, then we called:
    .transition()  // animate radius growing
    .duration(4500)// over 4.5 seconds
    .attr('r', function(d) {return d.r;});
This creates a transition (an animation) lasting 4.5 seconds over which radius will increase (from zero) to the value specified by the object bound to this element.
       update
          // place at x,y
          .attr('cx', function(d) { return d.x; })
          .attr('cy', function(d) { return d.y; });
The next statement uses the update selection. It should be noted that when using the append() method of an enter selection, the newly appended elements are automatically added to the update selection. This has immense impact on the code you write and you will find yourself using the idiomatic update pattern throughout your code. Continuing with the above, the elements added (or already existing) have their center points set, based on the data.
update
          // for exiting dots, transition radius to zero, then remove
          // from DOM
          .exit()
          .transition()
          .duration(4500)
          .attr('r', 0)
          .remove();
    };
The final statement of the function uses the exit selection, and, mirroring the transition of the newly created circles, old circles reduce their radius to zero over 4.5 seconds and then are removed from the DOM.
Even in this simple application, there is a lot to wrap your head around. Focus on understanding data joins and the update pattern. They are the heart and soul of D3 programming.
Not Just SVG
As a final beat-this-point-to-death (that D3 is not strictly an SVG library), I leave you with this demonstration. It creates a table based on data. Not a lick of SVG. It’s fully annotated and I think worth understanding.
Next…
This article is not so much a tutorial. More, a missive: what SVG is and is not, and why you might want to use it and, assuming you do, what to pay attention to when you start.
From here, I’d suggest reviewing the tutorials listed above.
Meanwhile, I’ll start working on my next D3 post, exploring some of those mysterious d3.svg.* functions.