This post will show you how to easily create interactive graphs which are simple to share.

IPython notebooks are a really nice way of sharing Python snippets intermingled with the results of those snippets and markdown.
They’re popular in the scientific community and are used in education (from Harvard CS109). IPython is well supported and documented, and is actually kind of a delight to use.
The creator, Fernando Perez, gave a keynote at PyCon US 2014 (there are a bunch of other talks worth watching too).
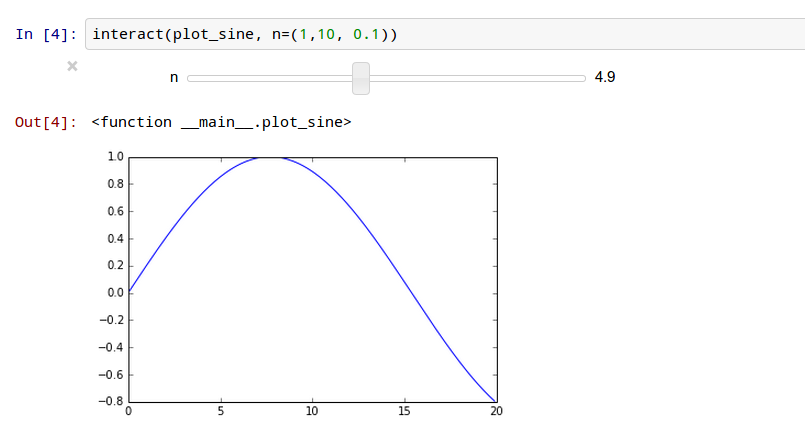
In release 2.0.0 in April 2014 IPython added interactive widgets. Interactive widgets provide gui inputs for you to interact with, for example, a graph. Here’s the simplest example I could come up with:


to try this for yourself:
- have a look at the notebook I created, which gives instructions for installing dependencies and starting the notebook server
- download the notebook source from github into the same directory as your notebook server is running, and it should be available to open.
Then once you’ve executed the code cells (by pressing play in the toolbar while focused on the cell) you should be able to interact with the plot. Enjoy!


