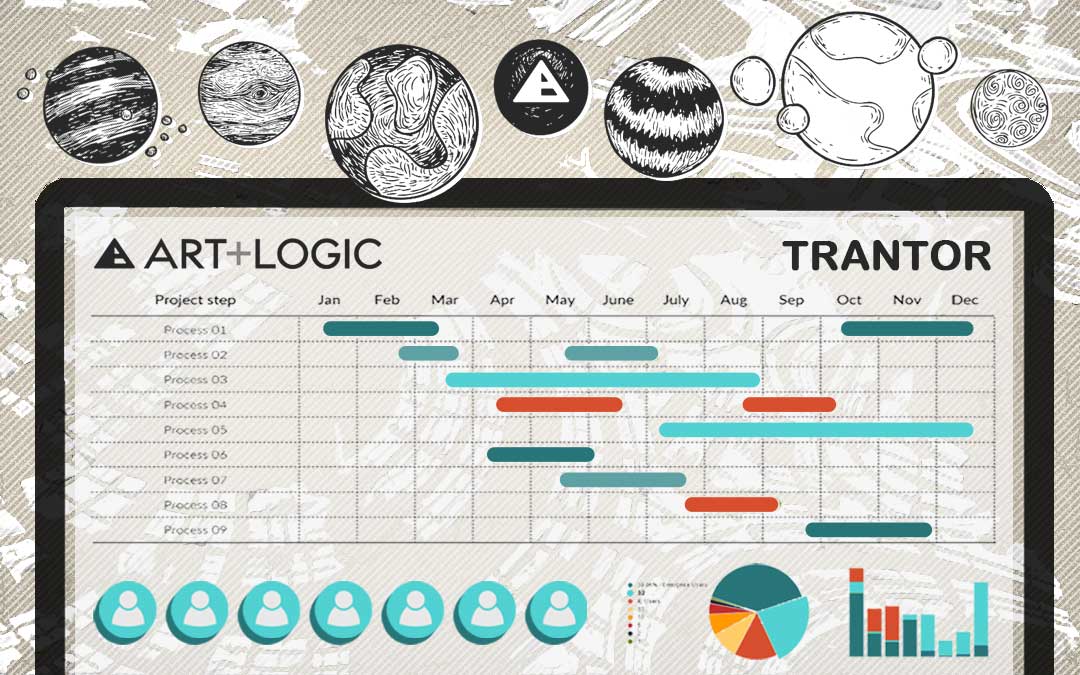
About 10 years ago, Art+Logic christened its homebuilt project tracking and management system. At our Annual Conference that year, we voted on the name “Trantor.” I’m not a sci-fi nut like most of my colleagues but apparently the name comes from Isaac Asimov’s Foundation Series. Trantor was a planet which, in Asimov’s world, was at the center of the galaxy. Although I haven’t read the series, I do love that our company continues to celebrate and imbue in its culture all things geek.
We migrated all of our old project data over to Trantor and since then have been using the robust application as the backbone to our proprietary project management technique. It is a massive enterprise application, integrated with every division here at Art+Logic and, at this time, rightfully embodies its namesake.
Hey John, could you give me a tally of the total number of billable hours in Trantor for all projects since we began using it?
731,071.27
At the beginning of this year I met with our DBA, Jon Gonzales. I pitched to Jon that I wanted to dig into this massive database and begin to extract information. I wanted to look at large projects and small projects. I wanted to do comparative analysis across several projects. But beyond that, my queries were ill-defined and murky. If you know anything about DBAs you’ll know that this is their favorite kind of request. Not.
Essentially, I was asking Jon to just go into the data and tell me something I don’t already know. Tell me what I might be able to learn from the data. Tell me what we might need to do to learn more, more accurately. I was being a bad client and I readily copped to it; I told him I owed him a beer.
A week later, I had charts and spreadsheets and more numbers than I knew what to do with. Jon basically started picking at the thread and, though the results were a little opaque, we were able to discover avenues of investigation.
But here are three surprising revelations I’ll be revisiting in the future:
- Art+Logic is able to ramp up a new developer to productivity on a project in less than 10 hours. That was shocking to me, even though I’d been selling that as a reason to use a full-service outsourced development firm for years. 10 hours to go from onboarding, development environment setup, and code orientation to providing traction to the development effort.
- Project Manager (PM) time isn’t exponential to the number of developers on a team, which is what I thought we’d see. There is no tipping point. Instead, it remains relatively low for self-PMed, 1-person and 2-person development teams, ticks up slightly at 3-person and then remains linear with each new developer added. And our PMs are able to manage large teams running concurrent Milestones/Sprints.
- In large project development running multiple concurrent Milestones/Sprints, the bottleneck on speed isn’t ramp up or PM capacity, its how quickly we can extract requirements from the client.
Jon and I are now focusing on QA time relevant to development time at certain phases of the project lifecycle. The idea is to graph this over time. I’d like to take a look at these graphs for projects that we would consider “healthy” and on ones we would consider suffering from pathology:
- What does this ratio look like when the decision is made to delay getting a beta release in front of users for early feedback?
- What does this look like when an aggressive schedule results in a “death march” to meet a deadline?
- What happens when a decision is made to add last minute features rather than lock a project for testing prior to beta?
I think all developers have a sense of healthy vs unhealthy project patterns, but I believe that by examining over 700,000 hours of effort building projects, Art+Logic will be able to provide valuable supporting data and analysis that will move what is primarily anecdotal and subjective information into data-supported objective observations we can use to better manage projects and equip our clients with the information they need to make better business decisions.


