I saw Square’s PonyDebugger project on GitHub a while back, starred it, and made a mental note to try it out in my next iOS project. It’s simply fantastic — easy to setup and incredible to use. If you’re an iOS developer be sure to add this one to your debugging toolkit.
 PonyDebugger is remote debugging toolset that uses a gateway server and the Chrome Developer Tools to allow you to inspect NSURLConnection based network activity, Core Data managed object contexts, and your view hierarchy remotely while your application is running.
To try this out I forked the UICollectionView example project created by Ash Furrow, formerly of 500px but now an iOS dev at Teehan + Lax. My repo is available on GitHub at UICollectionViewExample and Ash’s original blog post that details the original project is on his personal blog.
After forking Ash’s example project I installed the ponyd gateway server and iOS libraries following the directions in the PonyDebugger README and then signed up for a free developer account at 500px to get a consumer key and secret to be able to use the 500px API.
Once you have your key and secret you’ll want to insert them in the AFMasterViewController class. With those changes in place you should be able to run the example app in the iPhone simulator and load some popular images from 500px. To make it easier to inspect the app in the Chrome Developer Tools using the PonyDebugger gateway I added a simple bar button titled "Load" along with a loadPopularImages: method to the AFMasterViewController class to load the images on demand rather than automatically at startup.
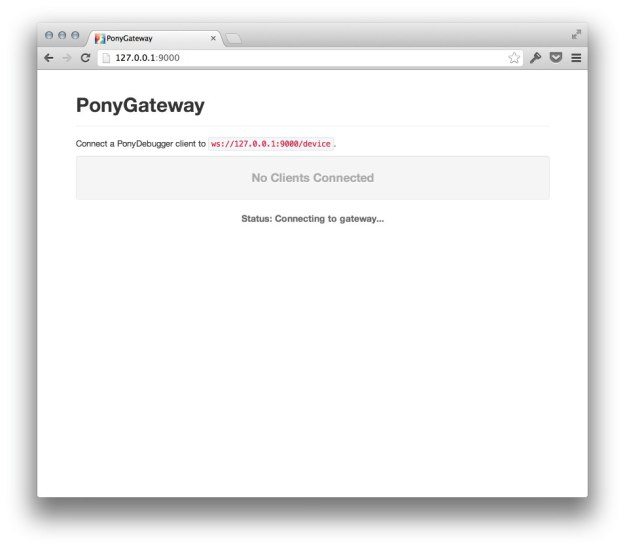
At this point if you open the PonyDebugger gateway in Google Chrome you should see that it’s running but no apps are visible yet.

To add support for PonyDebuger we’ll make a few changes to our app delegate:
- (BOOL)application:(UIApplication *)application didFinishLaunchingWithOptions:(NSDictionary *)launchOptions
{
   fDebugger = [PDDebugger defaultInstance];
   [fDebugger enableNetworkTrafficDebugging];
   [fDebugger forwardAllNetworkTraffic];
   [fDebugger enableCoreDataDebugging];
   [fDebugger addManagedObjectContext:self.managedObjectContext withName:@"Popular on 500px"];
   [fDebugger enableViewHierarchyDebugging];
   [fDebugger connectToURL:[NSURL URLWithString:@"ws://127.0.0.1:9000/device"]];
   [[UIApplication sharedApplication] setStatusBarStyle:UIStatusBarStyleBlackTranslucent];
   UINavigationController *navigationController = (UINavigationController *)self.window.rootViewController;
   AFMasterViewController *controller = (AFMasterViewController *)navigationController.topViewController;
   controller.managedObjectContext = self.managedObjectContext;
   return YES;
}
Here we create a debugger instance and configure it for network, Core Data, and view hierarchy inspection. Make sure to connect to the URL shown in your PonyDebugger gateway instance.
With these changes in place if you run the app you should see it in the PonyDebugger gateway:

If you click on the app you should see the Chrome Developer Tools. You’ll use the Elements tab for view hierarchy inspection, the Resource tab for taking a look at your Core Data Managed Object Contexts, and the Network tab for inspecting NSURLConnection based requests.
View Hierarchy Inspection
On the Elements tab of the Chrome Developer tools you’ll be able to expand and explore the view hierarchy of your application and see some basic information about your views. As you mouse over views within the hierarchy you’ll see that they’re highlighted within the app and as you use the app the hierarchy will update live. This is such a great tool for debugging view issues and seeing exactly where your views are located that you can enable with just a few lines of code.

Core Data Inspection
On the Resources tab you can take a look at the contents of your Core Data Managed Object Contexts that you ve exposed to PonyDebugger, again with just a few lines of code. You’ll find them under the "IndexedDB" section and can drill down into the objects and inspect their attribute values. For now it’s read-only but there are plans to allow editing values in a future release.

Network Inspection
Finally, on the Network tab you can inspect NSURLConnection based requests that have been made along with the response headers and body. In the screenshot here you can see the JSON returned from the 500px API that the example app uses to create NSManagedObjects that we can see in the Core Data inspector and to load the images displayed in the UICollectionView.

PonyDebugger in Action
Screenshots are great but PonyDebugger is best seen live. Using the example project I created a short screencast showing the app running in the iPhone Simulator and took a look inside the app using PonyDebugger.
Thanks to the dev team at Square for open sourcing this awesome toolset and to Ash Furrow for the excellent UICollectionView example. I’ll definitely be using it in all my iOS projects.


