When developing for macOS, iOS, tvOS, or watchOS to get the best performance or provide a secure solution you often need to develop apps that run asynchronously using tools such as XPC, GCD, and NSOperationQueue. Debugging this type of code can be difficult, especially when data is being passed between queues, threads, or processes.
Logging is an age old technique to help in these situations, but it’s easy to be overwhelmed by the amount of log data and to introduce or mask problems because of the observer effect — the overhead associated with many logging frameworks. I know logging isn’t exactly going to steal the headlines away from Siri integration or watchOS 3, but as a developer it’s a valuable debugging tool and the changes in these APIs look to save some significant time while debugging crashes and squashing bugs.
At WWDC this year Apple engineers gave a talk about their new Unified Logging and Activity Tracing APIs which is definitely worth checking out. The APIs are available in the latest versions of macOS, iOS, tvOS, and watchOS and are designed to replace the existing NSLog() and Apple System Logger (ASL) APIs. If you haven’t heard of the Activity Tracing APIs make sure to check out the talk given at WWDC ’14 when they were introduced. I hadn’t heard of them and based on the lack of blog posts about them, it looks like not many people did. However, the team over at objc.io unsurprisingly covered them well in their December 2014 issue on Debugging. Some of the Activity Tracing APIs introduced in 2014 are now deprecated, and are replaced by newer ones introduced this year so if you watch the talk from 2014 or read the article in objc.io, make sure to take the time to watch this year’s one as well to see what’s changed.
## Alright, so why should you use these new APIs?
- They’re designed to perform significantly better than NSLog() or ASL to minimize observer effect.
- The APIs are the same on all four of Apple’s platforms so if you take the time to learn them now, you can take advantage of them everywhere in the Apple ecosystem.
- They include automatic debug vs. production support so you’re not writing those preprocessor macros to turn off all your NSLog() statements in the shipping version of your app anymore.
- Activity Tracing lets you add context to a collection of log statements across queue, thread, and process boundaries and group smaller actions into a larger, more cohesive event.
- Apple has developed tools like log, ostraceutil, and an all new Console app (available in macOS 10.12 Sierra) that give you a lot more control over what is logged and tools to filter existing logs. No more searching the console in Xcode or setting breakpoints while trying to debug your collection of XPC services. With the log command you can even customize what is logged and how log data is managed while your app is running.
- The APIs are designed with user privacy in mind, to prevent you from logging sensitive user data when you shouldn’t be.
- Formatters for many common types are included so you get nice, human readable output without having to write another function to format an in_addr so you can see what the IP address value actually is.
- If you use these APIs your crash reports will include activity information and relevant log messages automatically, for free!
- You get debugger support in lldb. Just type “thread info” and see related activity and messages.
- When calling os_log_error or os_log_fault the system collects additional information from the OS relevant to your issue, for free.
- The new .logarchive format allows you to share log data with other developers incredibly easily.
- They’re simple — the entire API is probably fewer then a dozen functions.
New Features in Console in macOS 10.12 Sierra

Easily filter logs to only show errors and faults.

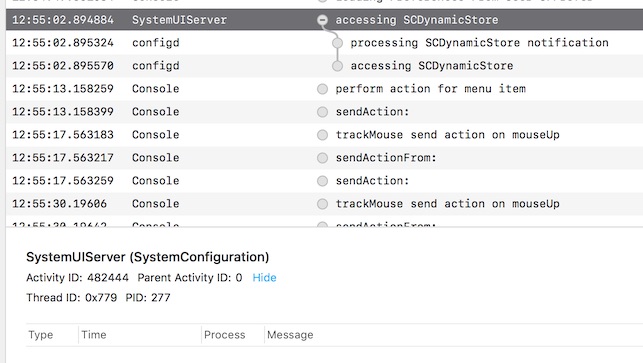
Visually track activities between processes. Shown here between SystemUIServer and configd.
Resources
- WWDC’16 – Unified Logging and Activity Tracing
- WWDC’14 – Fix Bugs Faster Using Activity Tracing
- Apple’s Logging API Documentation
- The os/log.h and os/trace.h header files in the latest SDKs.


