
// I need to

ModernizeUpgrade without breaking it RescueFix what someone else started Build NewTurn an idea into a product Reach More PeopleGet found, get used, include everyone

// Company

Case StudiesExpertiseAbout + CareersResourcesContact Book a call →

Interactive SVG Charts With D3: Part 2

Part 2 of a D3 tutorial on interactive SVG charts: add tooltips that appear when the mouse hovers over a data point, with live slides and JavaScript code.

Art+Logic Jun 8, 20161 min read

From the Art+Logic archive · written in 2016. The tools may have moved on; the thinking still holds.

Interactive SVG Charts With D3, Part 2
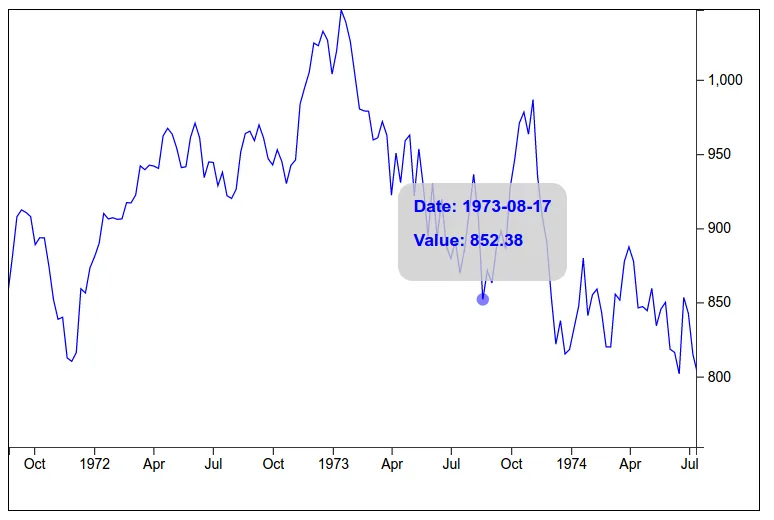
Adding tool-tips to an interactive chart.

This is Part 2 of a three part tutorial exploring building interactive charts with D3. Part 1 can be found Interactive SVG Charts With D3 - Part 1.

Other blog posts which can be used as introductory material to this series:

This tutorial is Part 2 in a multi-part tutorial exploring interactive SVG charts. We will pick up where we left off in Part 1 by adding tool-tips to each data point in the chart which become activated when a mouse hovers over a point.

We’ll progress over a series of “slides,” each showing an active SVG element with narrative text describing the key points of the slide, along with the javascript code that generated the SVG. As this is a tutorial on user interaction with SVG, you get to play along as we go.

This tutorial is a single-page app requiring a modern browser (tested on recent chrome, firefox, IE). Because this tutorial explores zooming, you will need to be using a computer with a wheel mouse. This tutorial can be run live in your browser at the wonderful bl.ocks.org site. If so inclined, you can also clone the tutorial from gist and run it locally on your computer.

Regardless of how you view the tutorial, you can leave comments about it here.

Enjoy!

keep going

More to explore in Build New.

All Build New resources →
let's talk

Got a problem like this one?

Tell us what's stuck. A real person replies within one business day.

Talk to our team →

Talk to people who know software, not a sales script.

Your first call is with Aja, our VP of Sales. He'll help make sure you're solving the right problem. Here's what you'll cover together:

  1. What you're trying to accomplish

    The business goal first, then the technology.

  2. Possible approaches

    And the tradeoffs of each, in plain language.

  3. Risks you may not have considered

    Technical and business, before they cost you.

  4. Whether AI changes the math

    What's practical, and what's just hype for your project.

  5. Sensible next steps

    Even if the right next step is not us.

book-a-call.ics

Loading the scheduler…

Open the booking page →

Some problems are easier to explain in writing. Send us a few lines about what you're working on, and we'll reply within one business day. Helpful to include:

  1. What the software does, or should do
  2. What's stuck, or what's worrying you
  3. Any deadline or budget you have in mind
note.md

Loading the form…